First of all , Ichimoku isn’t a character from a manga series, it’s a collection of indicators that show support, resistances, trend and momentum in a single indicator. It is also one of the most complex technical indicator that creates a lot of misunderstanding amongst novice traders.
What is the Ichimoku Cloud?
Ichimoku was created in Japan not by a trader but by a journalist named Goichi Hosoda around the 1960’s. While complicated at first glance , the Ichimoku cloud provides clear indications on potential entries in long and short positions.
The anathomy of the Ichimoku cloud
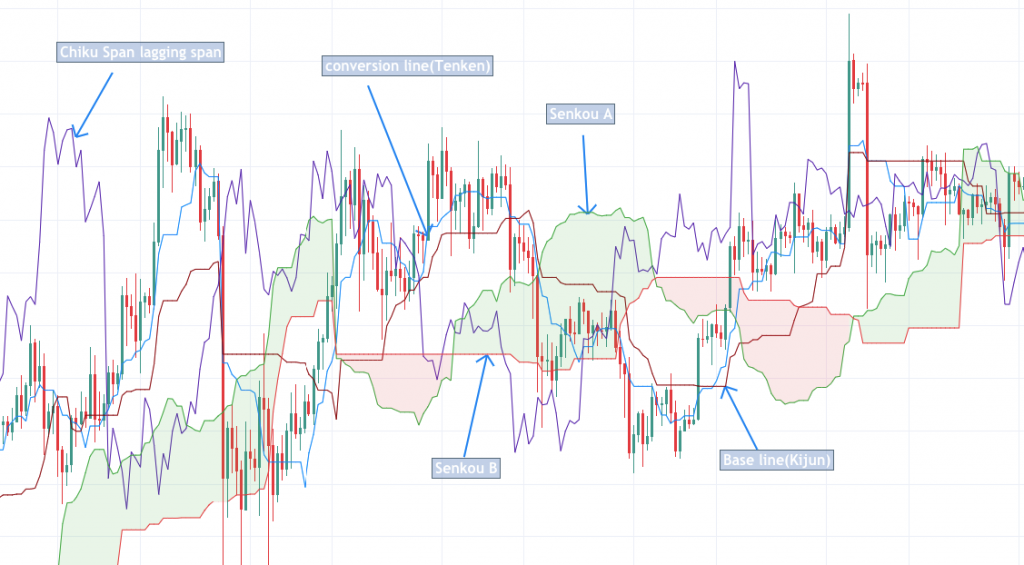
Ichimoku is composed of five lines :
- Chiku Span lagging span
- Tenken Sen or Conversion Line
- Kijun Sen or Base line
- Senkou A
- Senkou B
Tenken Sen and Kijun Sen are always analysed in correlation with one another and the both of them are analysed in correlation with the cloud formed by the differences between Senkou A and Senkou B . Tenken Sen and Kijun Sen are basically moving averages , with Tenken Sen(Conversion line) being the fastest MA and Kijun Sen(Base line) being a slower MA.
Generally when the short term term lead (Tenken Sen/Conversion line) crosses over the longer term lead (Kijun Sen/Base line) the market will move upwards, similarly when Tenken crosses below Kijun the market will move in a downwards manner.
Of course the Conversion line and the Base line should be analysed as a group and Senkou A and B in another group and both groups should be analysed in correlation with each other.
Using Ichimoku to establish a trend
As simple as it may sound after all this technical explanation , when the price is above the cloud we have an uptrend and when the price is below the cloud we have a downtrend.
When Senkou A is crossing over Senkou B and a green cloud is formed, the uptrend is reinforced. On the other side when Senkou A is crossing below Senkou B, a red cloud is formed further reinforcing the downtrend signal.
Using Ichimoku as a buy or sell signal
I want this to be as simple to understand for you guys so i have compressed the whole entry acquisition process.
Buy signal
When Tenkan(Conversion line) > Kijun(Base line) while Tenkan, Kijun AND the price > cloud
Sell Signal
When Tenkan(Conversion line) < Kijun(Base line) while Tenkan, Kijun AND the price < cloud
Advanced Ichimoku cloud checklist for confirming entries
Bullish Checklist
I want to confirm a bullish trend therefore i will only enter a long if the following conditions are met:
- ✅ The Price is above the Cloud.
- ✅ The Conversion line is above the Base line.
- ✅ The lagging span is above the candles
- ✅. The cloud is green so Senkou A >Senkou B.
- ✅. The price is near the Conversion or Base lines
- ✅. Price is not far from the Conversion line or the Base line
- ✅. Neither the conversion line, base line nor the lagging span are in a thick cloud.
Bearish Checklist
I want to confirm a bearish trend and therefore i will only enter a short if the following conditions are met:
- ✅. The price is below the cloud
- ✅. The Conversion line is above the Base line
- ✅. The lagging span is below the candles
- ✅. The cloud is red so Senkou A < Senkou B.
- ✅. The price is near the Conversion or Base lines
- ✅. Price is not far from the Conversion line or the Base line
- ✅. Neither the conversion line, base line nor the lagging span are in a thick cloud.
How to apply Ichimoku to trading cryptocurrencies?
Ichimoku can be applied to basically any timeframe and can be adapted to every market that has candles. As with any other indicator, trading based on ichimoku only can or can not be a good idea. With the cryptocurrency markets , sudden drops or pumps happen very often and even the most reliable indicator can be messed up .
Always try to think outside the box, respect you risk management and do your analysis and take note of every possible signal for your given pair, average them out and only then post a trade.