This week in crypto started boring and as expected, the so called volatility spring broke to the lowside this time. This is our market recap for the 2nd week of June 2020. We have not posted any BTC trading signals this week because our accuracy was lower than our standard.
BTC/USD
From yesterday’s high at $9956 the price of Bitcoin has decreased by 8.75% as it fell to $9086 at its lowest point today. From there we have seen a minor recovery with the price currently being traded at $9464.5
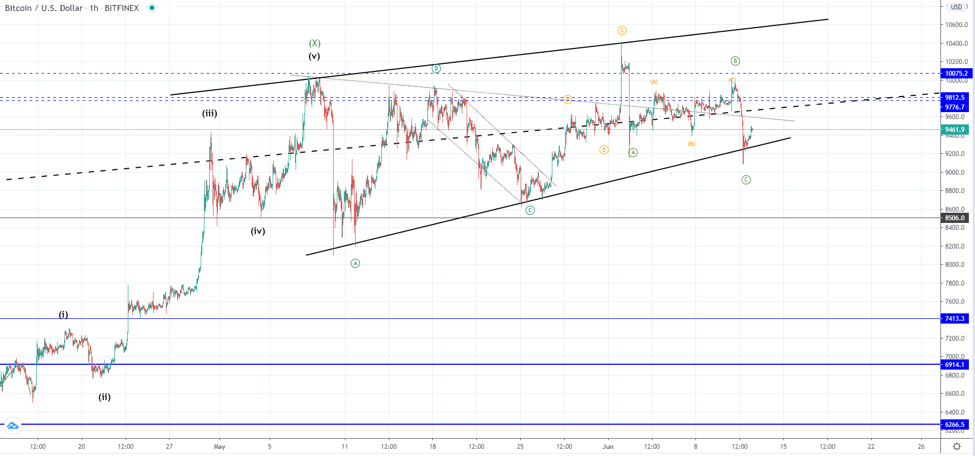
Looking at the hourly chart, you can see that the price came down to the ascending channels support level where it made interaction and found support there which is why we have seen a slight bounce.
A breakout below the interrupted ascending level has been made which is the midpoint of the current ascending range but it predates it and starts all the way back from in February of 2019 as a support level from the bullish period then made.
This could have been a final retest of the mentioned interrupted ascending level from the lower side as it was broken to the downside on the 8th of March. The wave structure implies that we are still seeing a corrective count with the price action forming another ABC to the downside so further upside movements that are to retest some of the significant resistance levels are still in play.
Another possibility could be that we have seen the development of the next five-wave impulse to the downside in which case today’s descending move would be it’s 3rd wave and is yet to develop fully as a breakout from the ascending channel.
If the price continues increasing from here and makes it past the ascending range midpoint further increase could be expected as a potential retest of the channels upper level or even a breakout to the upside, but if it starts moving to the downside and breaks its support it could mark the completion of the bullish period.
KNC/BTC
Kyber Network is an on-chain liquidity protocol that aggregates liquidity from a wide range of reserves, powering instant and secure token exchange in any decentralized application.
How about testing our services for free for 7 days? Go for it, worst case scenario – you learn something new 👉interact with our bot
The price of Kyber Network has been experiencing an exponential rise since the start of June as it came up by 93.98% from the 2nd of June compared to Bitcoin. Yesterday it was sitting on it’s highest point since July 2018 at 13581 SAT and from there made a decrease of 8.13%

On the hourly chart, we can see that yesterday’s spike was made in a five-wave manner and that after a descending range made in a three-wave manner. This is why I believe that the five-wave impulse that has led the price into an exponential increase came to a completion and that from here we are going to see a correction of a higher degree possibly leading the price back to the vicinity of the 1st wave’s ending point which would be at around 9300 SAT.