The price of Ripple has been increasing from yesterday’s low at $0.18949 and came up to $0.19475 at its highest point today which was a 2.77% increase. Since then we have seen a minor retracement with the price currently being traded again slightly lower than on today’s high but is still in an upward trajectory.
Looking at the 2-hour chart we can see that the price started interacting with the significant horizontal resistance level at the 0.382 Fib level where today’s high has been made and the price was stopped out at the first interaction but it now appears that the level is to be broken as the price fell for a minor retracement and is showing signs of strong bullish momentum.
Want to test our cryptocurrency trading signals for 7 days free?
Go for it, worst case scenario, you learn something new .
Go ahead, 👉interact with our bot
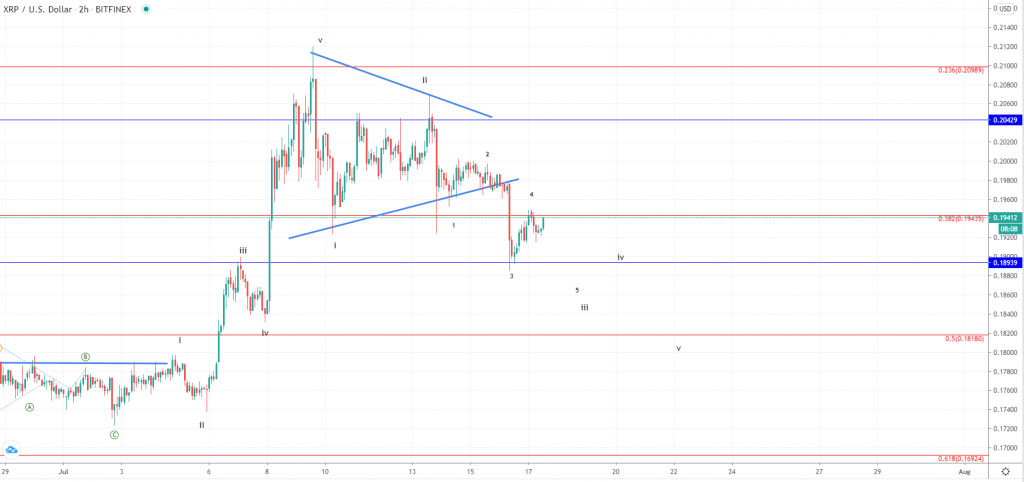
Taking a look at the price action development on a higher degree we can see that the price spiked to the upside from the 2nd of July when it was sitting at $0.1739 to $0.2118 which was an increase of 22.13% and has since started forming a symmetrical triangle.
This symmetrical triangle got broken on yesterday’s move to the downside but the price found support today on the significant horizontal level at $0.189 and started bouncing. We can interpret this as a sign of a bullish corrective move that is set to bring the price of Ripple back to retest the vicinity of the prior lower low and the 1st sub-wave of the 3rd one of a higher degree count which would be at around $0.1976, but if it starts entering the upper range this outlined bearish count would be invalidated and would indicate that the corrective move to the downside has ended.
At the time of writing the price did spike up and entered the territory of the first sub-wave making the prior count invalidated but still wanted to keep the prior writing to explain why it was valid in the first place. Now as the price spiked up and broke the horizontal resistance we are seeing the validation of the bullish count with the price showing a bullish scenario.
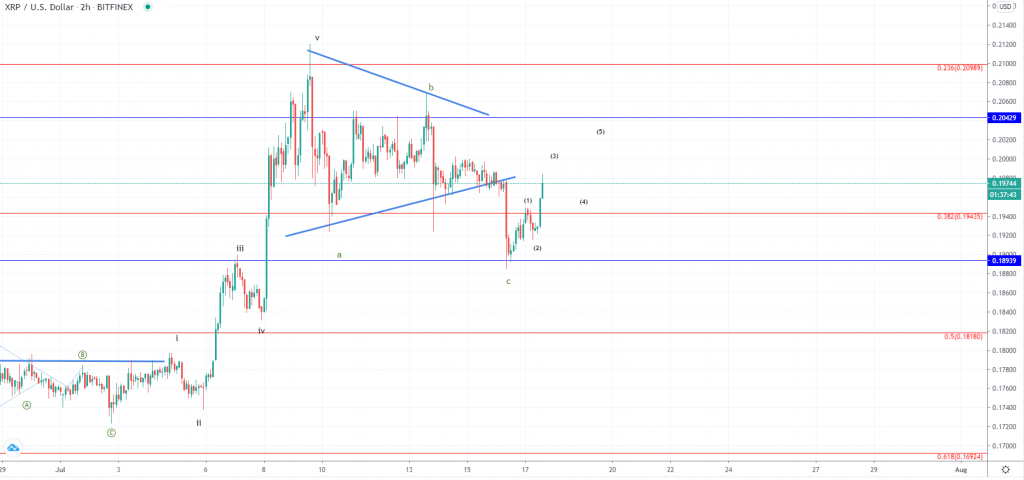
In this case, we have seen the completion of the three-wave ABC to the downside and the move that followed to the upside is the 1st sub-wave of the next impulse wave or another corrective structure but is in either way going to push the price of Ripple higher, at least to its half triangle range at around $0.2 but it is still unclear wheater or this move to the upside would end in a five-wave manner or in a three-wave one.
If it ends as a three-wave one it might indicate that the previously labeled C wave is also a three-wave one making this the D and that means that another D to the downside can be expected, making this whole structure an ABCDE correction in a descending triangle.
In either way from here further upside would be anticipated and from the first retracement we it’s depth and momentum we are to evaluate the possibilities.