Despite the scary sounding title, you don’t need to have a PhD in math or be some kind of rocket scientist in order to understand the quantitative approach of well… anything. While you do need to have some basic understanding of statistics, quantitative analysis is based on simple calculations of standard deviations and how to fit a straight line on a set of data points.
When we created our past cryptocurrency trading bots , many aspects of quantitative trading were of the upmost importance. Creating a backtesting environment, getting correct historical data, trading capital , were just a few aspects we struggled with in the beginning. These aspects make or break the success of a trading strategy applied to a trading robot.
Applying quantitative analysis to cryptocurrency trading signals
In order to create a streamlined process for our cryptocurrency signals, we decided to split the whole workflow in several steps that we can manage on a semi-automated basis. With SublimeTraders, the bulk of a signal comes from the scanner, a trading robot that does not execute. The bot gathers all informations as it would if it were running autonomously and sends the buy or sell signal to us, we check and compare to the current market situation and then issue a trading signal for our users.

SublimeScanner is basically just a piece of our trading robot that we modded to suit our trading signal needs. The trading system exists in it’s entirety and is used with one of the first cryptocurrency hedge funds around.
Quantitative trading signals
The process of trade signal acquisition is tedious and sometimes needs extensive research in order to produce good results. The cryptocurrency scanner does backtests in real time and we receive the data as being positive or negative but these backtests are based on historical data and not always accurate.
That’s why we decided to implement 4 more parameters to the scanner so we get a clearer message that would facilitate our task. In addition to backtesting we implemented realtime volume with alerts, the velocity of the last trades, cross exchange aggregation and VWAP. We base the majority of our trading signals on the 1hour and the 4hour charts.
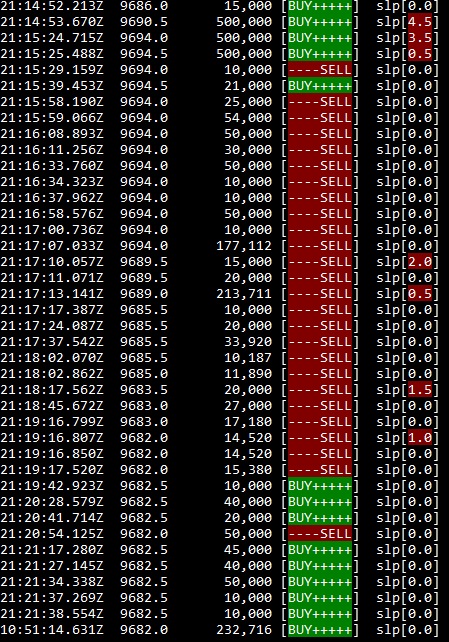
Velocity of the last trades: Simple yet effective tool that tracks the speed of the last trades in one direction or another, for example we track single trades of 10k or more for BTCUSD futures.
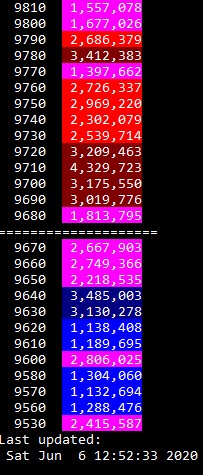
Realtime Volume: we interpret it a bit like the VPVR indicator on Tradingview, where we constantly watch for buy and sell walls and the duration of the walls at a certain level. Part of the tool in this example.
Cross Exchange aggregation: Might be one of the most important manual indication factors for our decisions. This tool aggregates 7 exchange’s orderbooks and displays discrepancies.
VWAP: Short for Volume Weighted Average Price , gives us a cleared indication of the possible direction a certain asset might take.
We will be setting up a stream with the last trade velocity and the combined orderbook to let you guys have a glimpse of what is going on behind the scene with Sublime Traders.
Backtesting is only a small part of the trading game when it comes to preparation, wether we trade manually , low or high frequency, risk management is the key to succeeding on the long term. We will be creating an article regarding risk management shortly so make sure you follow our blog or our free telegram channel .