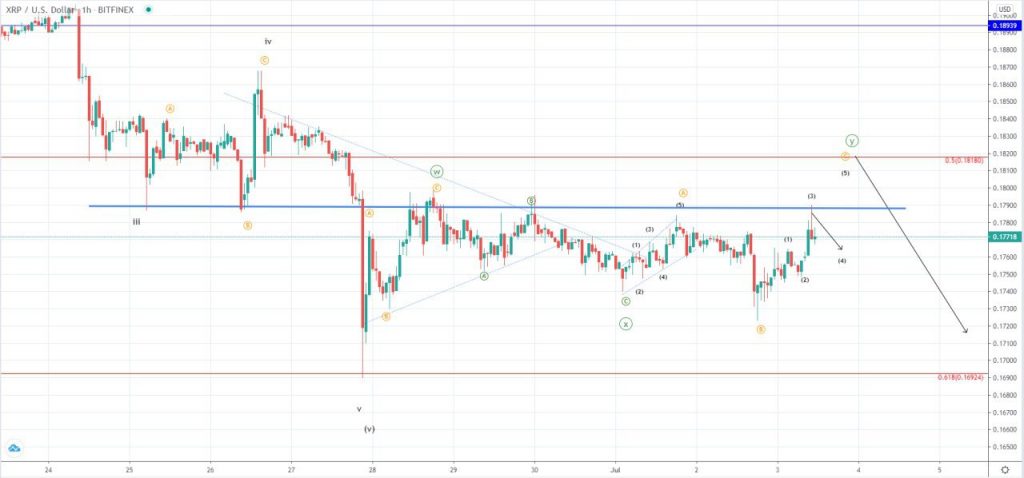
XRP/USD on 3 July
The price of Ripple has been increasing from yesterday’s low at $0.17268 at its lowest point and came up to $0.17912 at its highest today which was an increase of 3.73%. Since then we have seen a minor retracement with the price currently being traded at around $0.1771 mark.

On the hourly chart, we can see that the price came up to the vicinity of its current horizontal resistance which was tested on the 28th of June after a breakout has been made to the downside and retested couple of times again before today’s spike.
As the price again found resistance we have seen a red bearish hourly candle with a wick on the upper side indicating strong seller’s pressure and is why now from these levels further downward movement would be expected.
Want to test our cryptocurrency trading signals for 7 days free?
Go for it, worst case scenario, you learn something new .
Go ahead, 👉interact with our bot
This descending move is to be a minor one and could not go below the $0.176 level where the territory of the 1st wave is or the current count in which we are seeing the development of the five-wave impulse to the upside would get invalidated. More likely the price is to come to those levels for another establishment of support before another attempt is to be made for a breakout to the upside with the first significant resistance level being the 0.5 Fibonacci one at $0.1818.
From the 27th of June, we have seen the price moving sideways which is most likely a corrective count out of which the currently seen increase would be it’s ending Y wave of a higher degree. This is why further downtrend continuation would be expected of a higher degree after the completion of this ascending one.
If this is true then the price is to continue moving lower then on the 27th of June but it could end around its vicinity at the minimum as a final retest of the support that is to mark the completion of the decline from the 17th.