The price of Chainlink has been in the green, percentage-wise today amidst the market taking a downturn but has also started following this trend as we have seen a decrease of 7.4% today with the price falling from its daily high at $8.74 to $8.09 and even spiked further to the downside at $7.88
It’s currently being traded above $8.167 and is starting to take a minor recovery which is why it is still a question of will the biggest winner in the previous period continues defying the larger trend and prove it’s resilience?
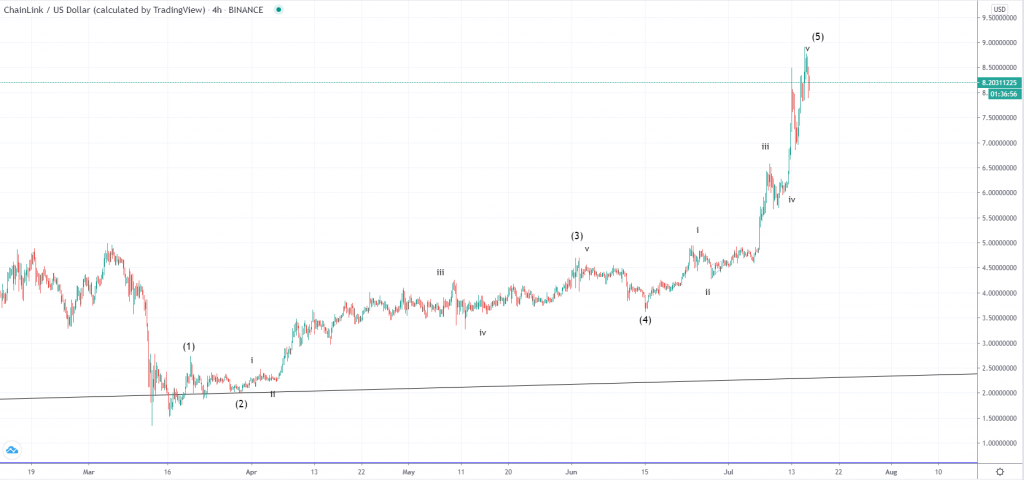
Unfortunately looking at the 4-h chart we can see that the price of Chainlink has been nothing but increasing from the 16th of March with all the corrective stages forming a sideways range and not making much retesting of the prior resistance for support.
Want to test our cryptocurrency trading signals for 7 days free?
Go for it, worst case scenario, you learn something new .
Go ahead, 👉interact with our bot
This fact proves to be a highly significant indicator that the price has moved to the upside in an unsustainable way and that on the next move to the downside the price is headed in the same manner as it went up.
From the 16th of April until 15 of June, we have seen strong consolidation in the range between $3.52 to $4.54 but after a breakout, the price moved parabolically to the upside in an even more unsustainable manner increasing by 136% in just little below a month.
As the wave structure implies that we have seen the completion of the impulsive five-wave move now we are expecting the start of the corrective wave to the downside of the same degree and if the price is to fall back to it’s strongest support we are to see a decrease of 50-60% as the most notable area to the downside is the mentioned consolidative range between $3.52 and $4.54 level.