Hi everyone we wanted to share with you this weeks overview for the cryptocurrency markets to hopefully help you understand more about them. As always, make your own analysis, check facts and don’t trade blindly, our cryptocurrency trading signals are just one part of your trade, use your risk management .
BTC/USD this week (14-19) June 2020
Since the start of the week, the price of Bitcoin has been recovering from its lowest point on Monday made at $8914 to $9594.4 which was an increase of 7.63%, but since then a minor retracement has been made with the price currently being traded around $9400 mark.
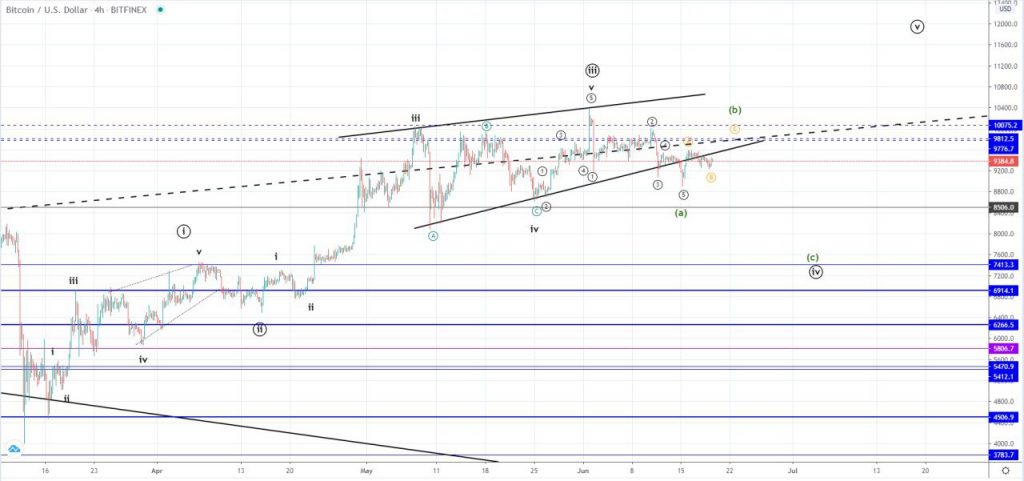
On the 4-hour chart, we can see that the price started to break out from the ascending triangle which started forming on the 11th of May when the first significant impulsive decrease was seen of around 18% as the price fell from $9994 to $8500 level and even spiked further to the downside around $8200, but the 4-hour candle closed above the mentioned horizontal level, validating it once more as a significant one.
A breakout attempt failed as the price came back inside the territory of the ascending range but it again slowly started to escape its lower baseline level. Now we are most likely to see an increase which is set to retest it from the upper side for resistance around $9540 before a proper breakout can be made is the seller’s provide resistance.
Since the 16th of March, the price of Bitcoin has been increasing and from its lowest point at around $4500 came up by 131.28% measured to its highest point on the 1st of June at $10359.3. This increase was made in the Bitcoin halving expectations which occurred on the 12 of May and was considered a highly significant event as the amount of Bitcoin per 10 mins got cut in double from 12.5 to 6.5. This is why the price action has been imprinting these expectations as the premise was the miners would have to find equilibrium with the price.
But now as the expectations have settled and the price increased by over two-fold we are likely seeing the completion of the bullish period.
Zooming out into the daily chart, you can see that the price has been in a downtrend since the 26th of June last year when it came up to $13761.
We have seen a three-wave WXY correction first followed but a three-wave move to the upside which was most likely the 2nd WXY correction before a major impulsive downfall from $10450 on the 13th of February to $4000 at its lowest point. This decrease was most likely the 1st sub-wave out of the third consecutive WXY correction which makes this increase from the 16th of March it’s 2nd sub-wave or the X wave of the Minute count.
If this is true we could have seen its completion as three 5-3-5 wave’s have developed which could be an ABC to the upside with the C wave forming an ending diagonal which is the ascending triangle from the 10th of May. As you can see the price made another attempt to breakout above the significant horizontal resistance zone around $10000 for the second time and this struggle to surpass this level is likely to mark the ending of this increase.
Want to test our services for 7 days free? Go for it, worst case scenario – you learn something new
👉 interact with our bot
This horizontal resistance was serving as support from last year in June till an impulsive breakout in 23th of September and the price was training below it since then. Also, another significant level is the interrupted ascending one below which the price is currently being traded and it dates all the way back from February of 2019 when the price started increase from $3200 level till it’s yearly high and was considered the baseline support. A breakout of this level was seen on the presumed 3rd WXY starting point wave W and now as the price came back to both of these levels – the horizontal resistance and the ascending one and is showing signs of weakness this could be considered a retest of the broken support for resistance before further downside movement.
Zooming into the hourly chart, we can see that from the 2nd of Jun when the price came up to its highest point a five-wave structure has formed that made fake-out below the ascending channels support.

After this, an increase seen has pushed the price inside its territory and is now struggling to keep up the upward momentum. If what was stated earlier is true the current increase is set to end as a three-wave corrective increase to around the vicinity of the intersection between the two mentioned significant levels at around $9800 and would be the first two sub-waves of the starting impulse to the downside.
This starting impulse in a five-wave manner would again be the A wave of a higher degree count and is likely to end at around the most significant horizontal support in line to the downside which is at $6914, but if this is the Y wave out of the third WXY correction then the downside potential is vast and could lead the price of Bitcoin below $3k. We are to evaluate this possibly from the depth and the momentum behind the expected downside move but in either way, from here we are likely to see a descending move.
Another less likely possibility but still a valid one would be that from the 16th of March we are seeing the development of the starting impulse wave that is set to push the market into another multi-year bull market.
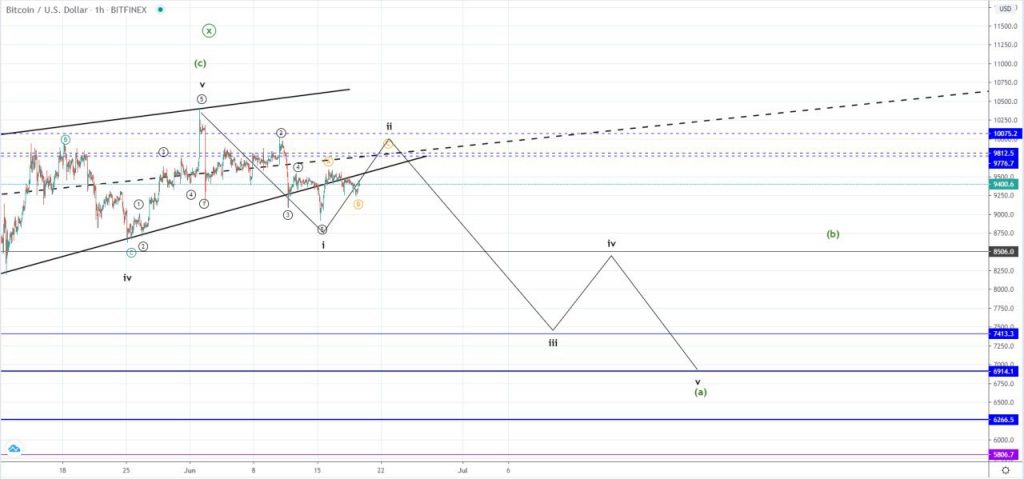
Looking at the alternative count you can see that the 5-3-5 move labeled as the upward ABC could be 1,2,3 waves with the currently expected breakout being it’s 4th and is why I believe that from here in either way we are seeing a descending move.
If the price finds support above the $7413 where the 1st wave ends an increase above the prior high could be expected most likely around $12000, but if the price starts going below the mentioned level it would invalidate the count and validate the primary one.
This is why closely following the market in the upcoming period and looking into the momentum and the depth can provide an early insight into the future macro trend but as the things stand the primary count is a bearish one.