This week’s altcoin overview is for Vitalik’s baby coin, Ethereum. Let’s dive straight in it.
ETH/USD overview
The price of Ethereum has been in a downtrend since the 2nd of June when an interaction with the ascending channel’s resistance was made at $253.42. From there we have seen a decrease of 13.95% until yesterday’s low as the price came down to $218 but as it came to the vicinity of the ascending channels baseline level and found the needed support another increase was seen to $235 area.
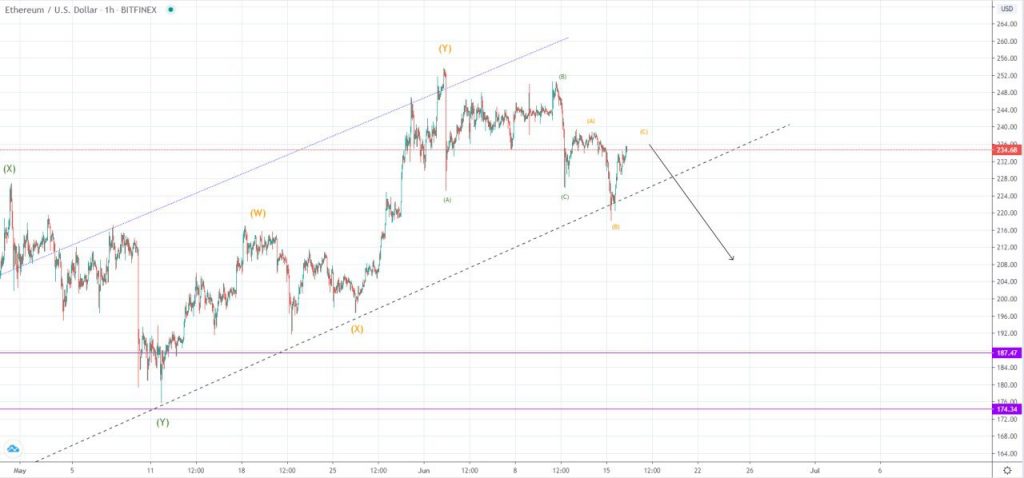
On the hourly chart, you can see that a fakeout occurred with the price of Ethereum almost starting to go below the ascending channel’s support but a breakout hasn’t been made as instead, the price spiked back to the levels from which the descending move was made.
This is why I believe we are seeing a corrective movement especially considering that the wave structure was made in a three-wave manner until last Thursday and the next wave ended back slightly inside its territory.
If we are seeing the development of the C wave from the upward ABC correction then it would be the 2nd sub-wave of a higher degree count which is why a third one would be expected to develop. This one would be at least the same or stronger momentum and is to lead the price of Ethereum for a proper breakout below the ascending channel’s baseline and potentially all the way down to $187 area where the next significant horizontal support would be.
Want to test our services for 7 days free? Go for it, worst case scenario – you learn something new 👉 interact with our bot
If, however, this was the completion of another retracement that has retested the channel’s support and ended there, the ascending move we have seen today would be the first sub-wave of the next movement to the upside which could bring the price of Ethereum above it’s prior June’s high.
These possibilities would be validated from the now expected retracement which is set either to end around $228 area in a bullish scenario after which further upside movement would be seen or would continue moving below the yesterday’s low at around $220.
ETH/USD trading signals
Every single cryptocurrency trading signal we provide is backed up by solid analysis . ETH is a good mover and compared to BTC has smaller wicks on futures exchanges, seems easier to trade right?
The price of Ethereum has been in a downtrend since the 2nd of June when an interaction with the ascending channel’s resistance was made at $253.42. From there we have seen a decrease of 13.95% until yesterday’s low as the price came down to $218 but as it came to the vicinity of the ascending channels baseline level and found the needed support another increase was seen to $235 area.
On the hourly chart, you can see that a fakeout occurred with the price of Ethereum almost starting to go below the ascending channel’s support but a breakout hasn’t been made as instead, the price spiked back to the levels from which the descending move was made.
This is why I believe we are seeing a corrective movement especially considering that the wave structure was made in a three-wave manner until last Thursday and the next wave ended back slightly inside its territory.
If we are seeing the development of the C wave from the upward ABC correction then it would be the 2nd sub-wave of a higher degree count which is why a third one would be expected to develop. This one would be at least the same or stronger momentum and is to lead the price of Ethereum for a proper breakout below the ascending channel’s baseline and potentially all the way down to $187 area where the next significant horizontal support would be.
If, however, this was the completion of another retracement that has retested the channel’s support and ended there, the ascending move we have seen today would be the first sub-wave of the next movement to the upside which could bring the price of Ethereum above it’s prior Jun’s high.
These possibilities would be validated from the now expected retracement which is set either to end around $228 area in a bullish scenario after which further upside movement would be seen or would continue moving below the yesterday’s low at around $220.
From the 12th of May, we have seen a three-wave increase which is corrective according to my count but there is still a possibility that it will develop in a five-wave manner as the price hasn’t got inside the territory of the W or the 1st wave below $216. This is why if it does it would validate the count and mark the end of the higher degree upside movement for the price of Ethereum.
But if it continues moving to the upside from here without making a lower low compared to yesterday’s one it could mean that the descending move from the 2nd of June was the 4th wave out of the five-wave impulse to the upside.