ZRX/BTC – 26th June 2020
The price of 0x has been moving to the upside amid the market decline as we have seen today and increased by around 9.78% compared to Bitcoin, coming from 3592 SAT to 3944 SAT at its highest point around which it is still being traded.
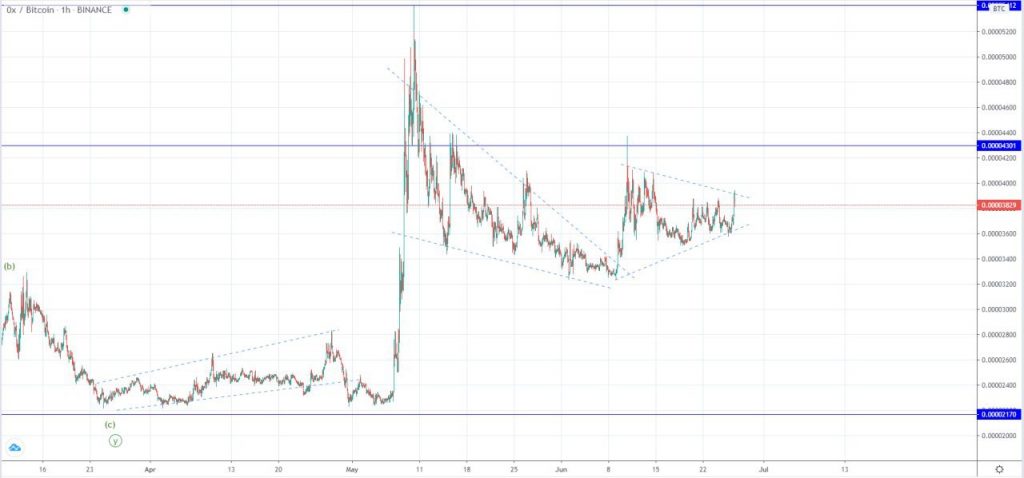
Looking at the hourly chart, you can see that the price has broken out from the descending triangle which was formed after an impulsive spike to the upside of 140% was made from the 6th of March till the 10th, and corrected by approximately 40%.
The breakout seen also started forming another triangle but this one appears to be a symmetrical one which does not indicate the breakout direction at this point. The price has established a resistance level on today’s high as the interaction was stopped out on a lower high.
From here the price is likely to continue moving a bit more inside the boundaries of the symmetrical triangle in the next couple of days until the next impulsive move will be made.
Want to test our cryptocurrency trading signals for 7 days free?
Go for it, worst case scenario, you learn something new .
Go ahead, 👉 interact with our bot
Zooming out on the daily chart, we can see that the price of 0x started increasing from the 19th of September last year when a breakout was made from the higher degree decrease was made after which it established support at around 2170 horizontal level.
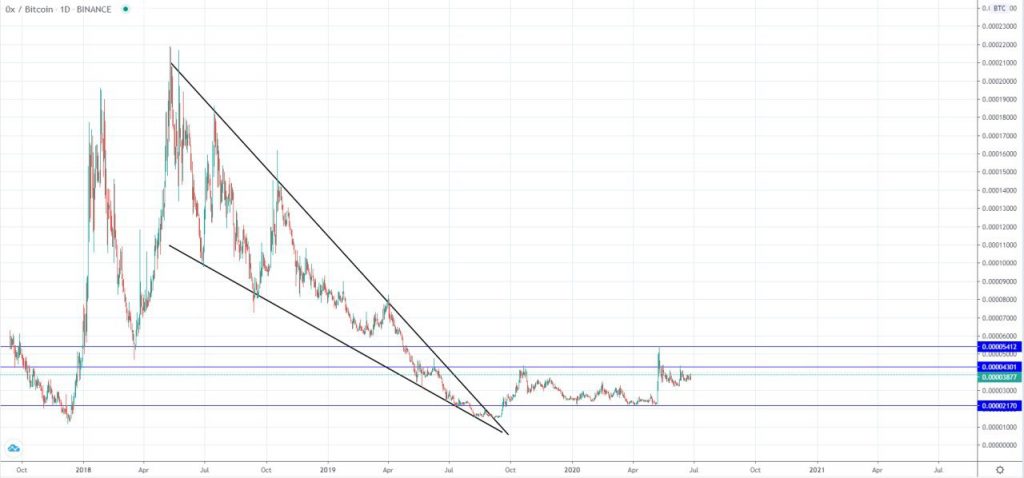
After this support level was established we have seen the recent spike to the upside which could indicate that the start of another bull cycle has been in development.
Zooming into the 4h chart and looking at the wave structure it appears that a five-wave impulse was developed from September last year and it could be the starting wave in which case the last increase would be it’s 3rd.
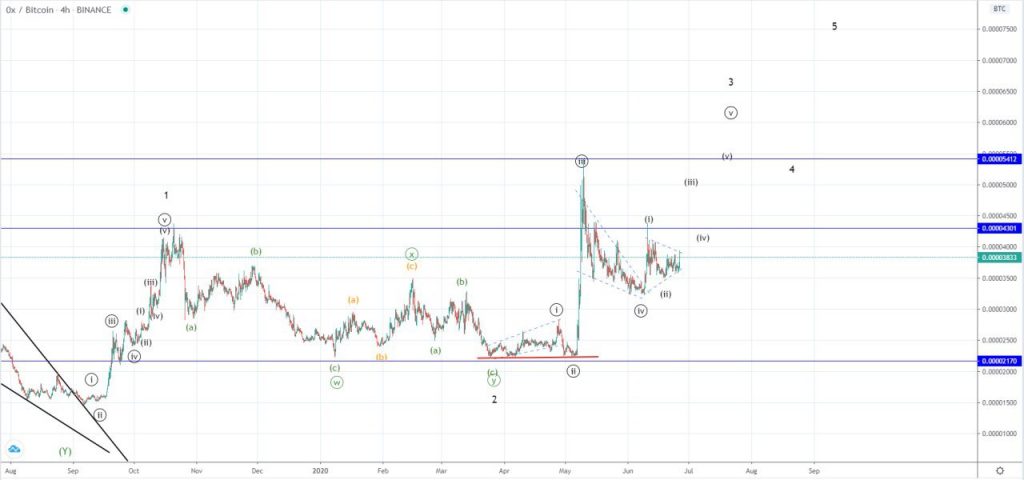
If this is true then further upside movement would be expected from here as the five-wave impulse should develop fully. However the problematic area is the first wave out of the presumed last impulse which arrears to have developed as a leading diagonal with the 2nd wave falling back to it’s starting point (red horizontal line).
This is why I don’t believe we are seeing a five-wave impulse to the upside from the 26th of March but rather that the now labeled 1st wave out the presumed 3rd wave is the part of the same corrective structure that started in October last year.
In that case this last increase would be the C wave from the another corrective ABC count to the upside from the breakout of the descending triangle made in September last year and would end on the next wave to the upside.
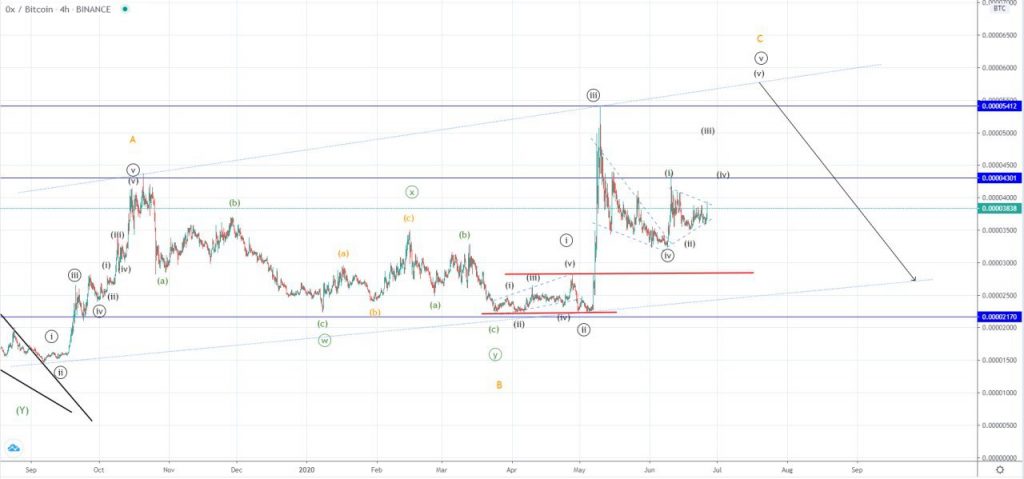
But in either way I would be expecting an increase from here for another move to the upside and a higher high compared to the one made in May, however this symmetrical triangle that we are currently seeing might not be the starting 5th wave out of the Minute count and could instead be another sub-wave of the 4th wave which is corrective in nature and could bring the price back to the upper red level which is the start of 1st wave’s the territory in which the price cannot enter if we are seeing the development of the five-wave impulse.
Make sure you follow our free telegram trading signals channel to get free trading signals, market analysis and trade ideas.