We try to provide as much info as possible for our community regarding all the trades we chose and the logic behind them. While it is difficult to detail certain quantitative aspects of our cryptocurrency trading signals, we will from now on provide technical analysis like this here post.
ADA/USD overview
The price of Cardano has been increasing since the 16th of March when it was being traded at $0.02086 at its lowest point and came up to $0.09375 at it’s highest which was an increase of 349.3%.
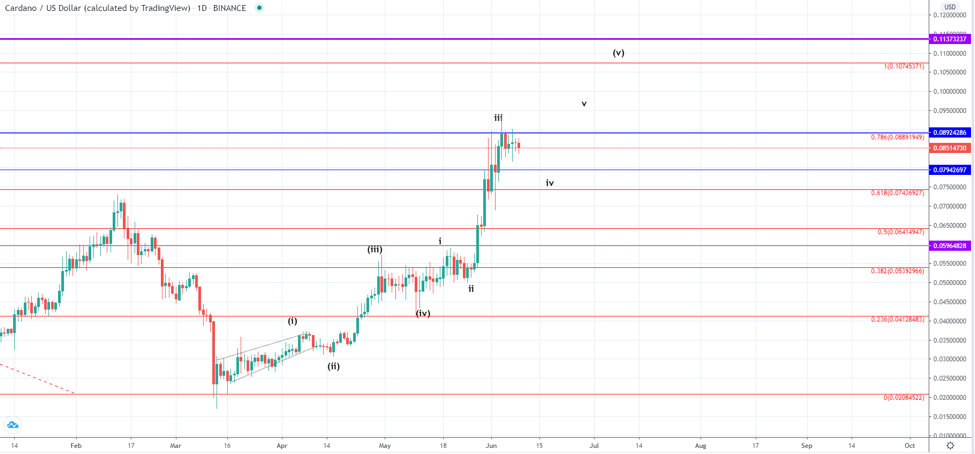
On the daily chart, we can see that the price came up to the 0.786 Fibonacci level where it found resistance which correlates with the significant horizontal level at $0.0892. As the increase was stopped out a local retracement has been seen but this is likely to continue in the near future especially considering the amount of increase in one go.
Namely, after a breakout above the 0.382 Fibonacci level we have seen an impulsive spike of 74% which was most likely the 3rd wave out of the five-wave impulse of a lower degree count from the 12th of May which is the 5th wave from the impulse that started on the 16th of March.
This is why now we would be expecting a retracement continuation to the 0.618 Fib level at optimum at around $0.07436 before further upside continuation.
Zooming into the hourly chart we can see that the wave structure implies another move to the upside is imminent but it is still unclear where it could end as there are multiple significant horizontal levels in between.
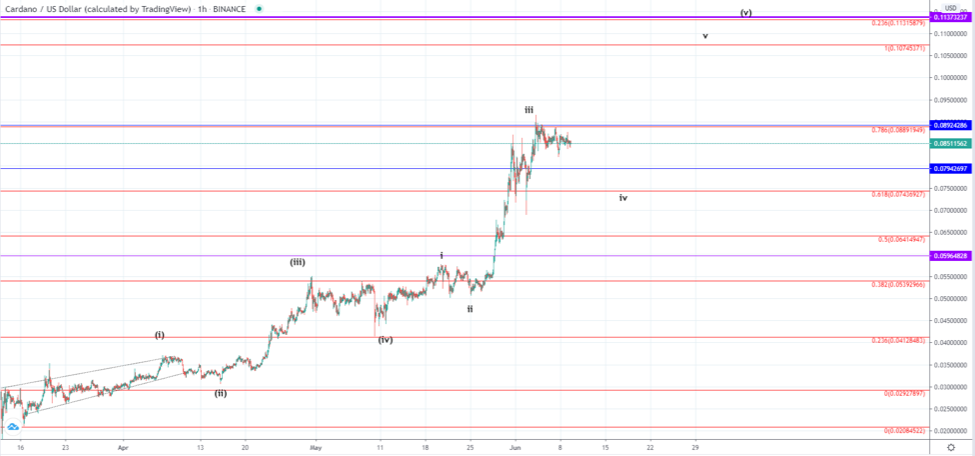
In theory, the price could go as low as the 1st wave out of the lower degree count which would be at $0.057 but is more likely to stay above the 0.618 Fibonacci level on the 4th wave’s retracement.
Another increase to the upside would be set to exceed the high made on Jun the 4th at $0.0889 and the most optimal price target would be in between the 1 Fib level and the 0.786 one, around the $0.1 mark, but it could exceed that target and reach the vicinity of the prior high on the higher time frame at the most significant horizontal level to the upside which would be at $0.1137
ADA/BTC
Looking at the Cardano to Bitcoin daily chart we can see a similar pattern which makes this probability more likely as it would mean that the price of Cardano is headed for an increase in BTC evaluation as well.
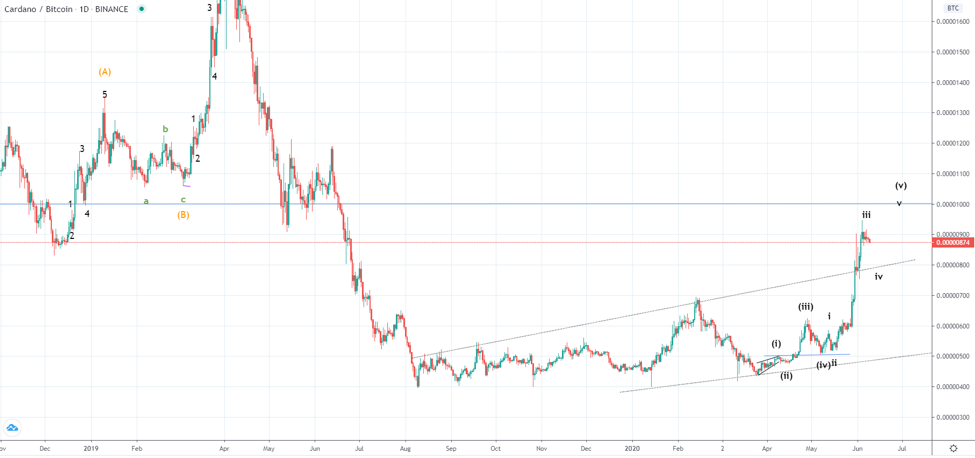
Of course like on the USD pair prior to the expected increase, further retracement would be expected to the broken ascending trendline which was the resistance level of the ascending channel, bringing the price to 800 SAT.
After that, the price target for the completion of the upward movement would be at the horizontal support in 2019 which is at around 1000 SAT.
Interested in our community , join now for free .